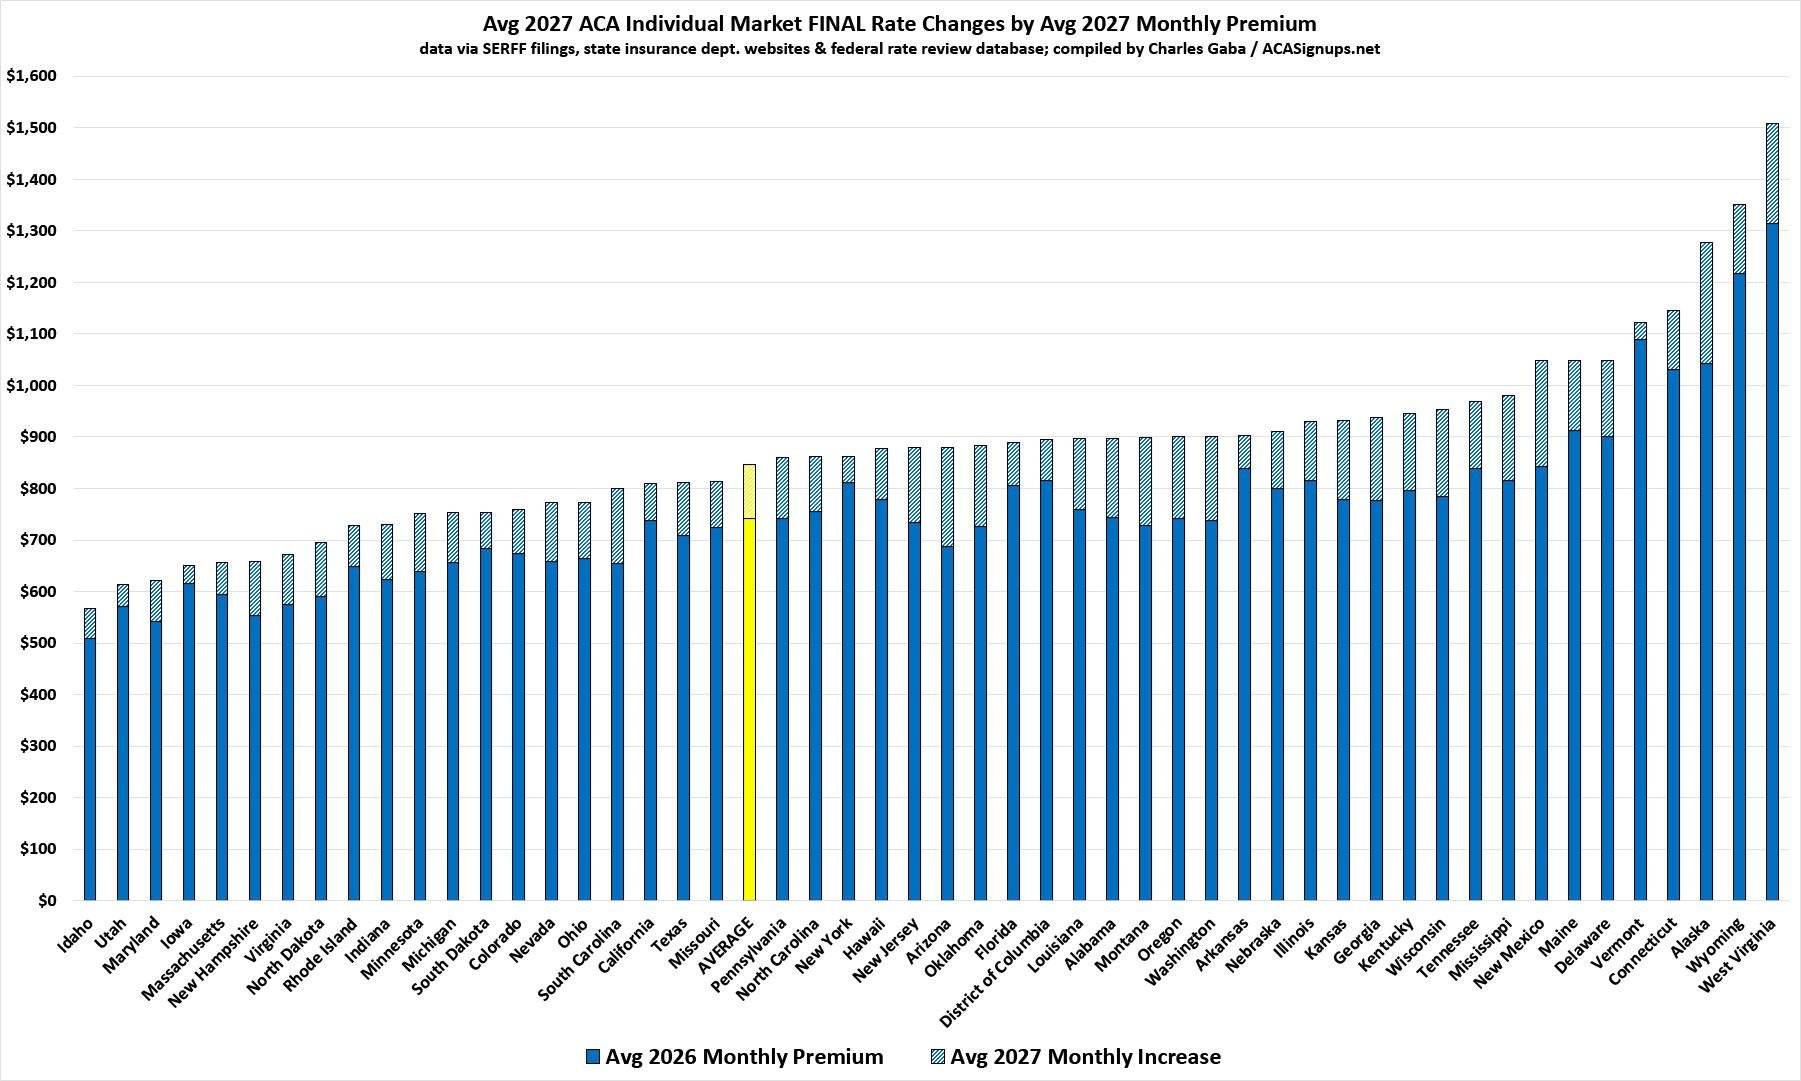
Final 2027 rates average $845 a month for unsubsidized ACA enrollees, up about $104 from 2026, with wide differences among states.


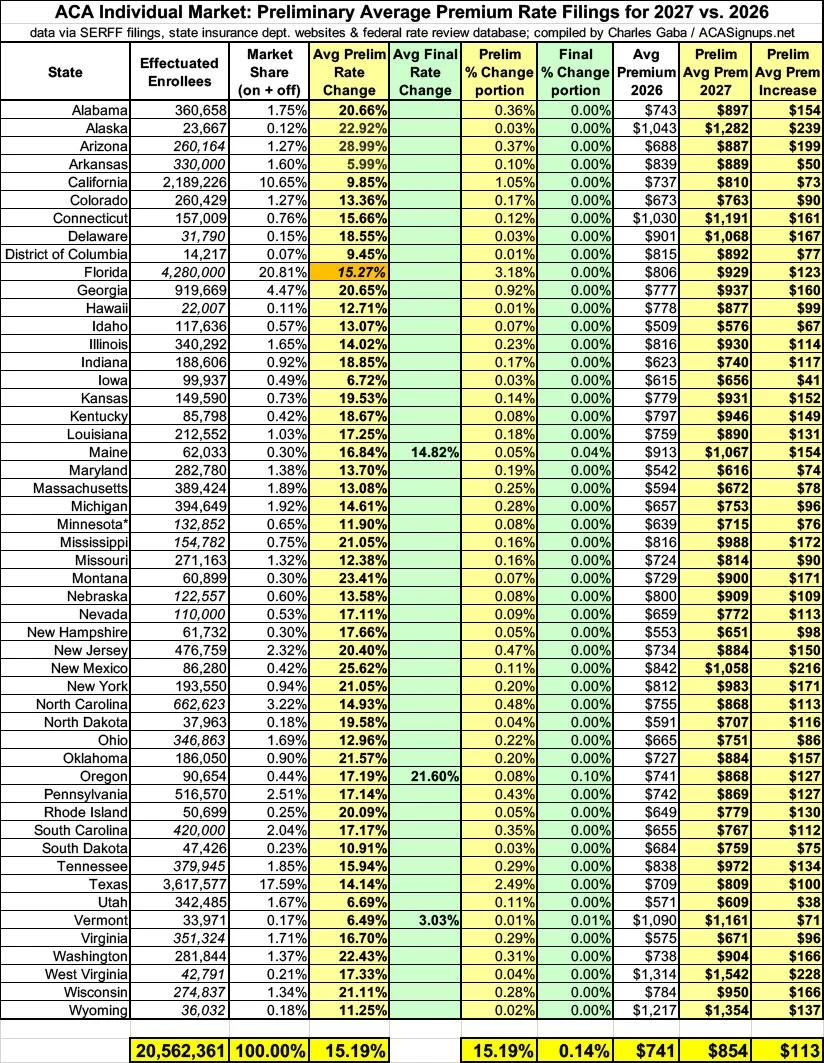
Final 2027 rates leave unsubsidized individual market enrollees facing an average increase of about 14.1% across the country. That puts the estimated monthly premium at roughly $845, up about $104 from the 2026 average of $741. The national figure is a useful benchmark, but it masks sharp differences in both rate changes and premium levels from state to state.
The figures cover ACA-compliant individual market plans, including policies sold through the exchange and directly to consumers. The estimated market enrollment in March or April 2026 was about 20.5 million people: roughly 18.6 million enrolled through the exchange, with as many as 2 million in off-exchange plans. These enrollment estimates help weight the state averages, so states with more enrollees have a larger effect on the national result.
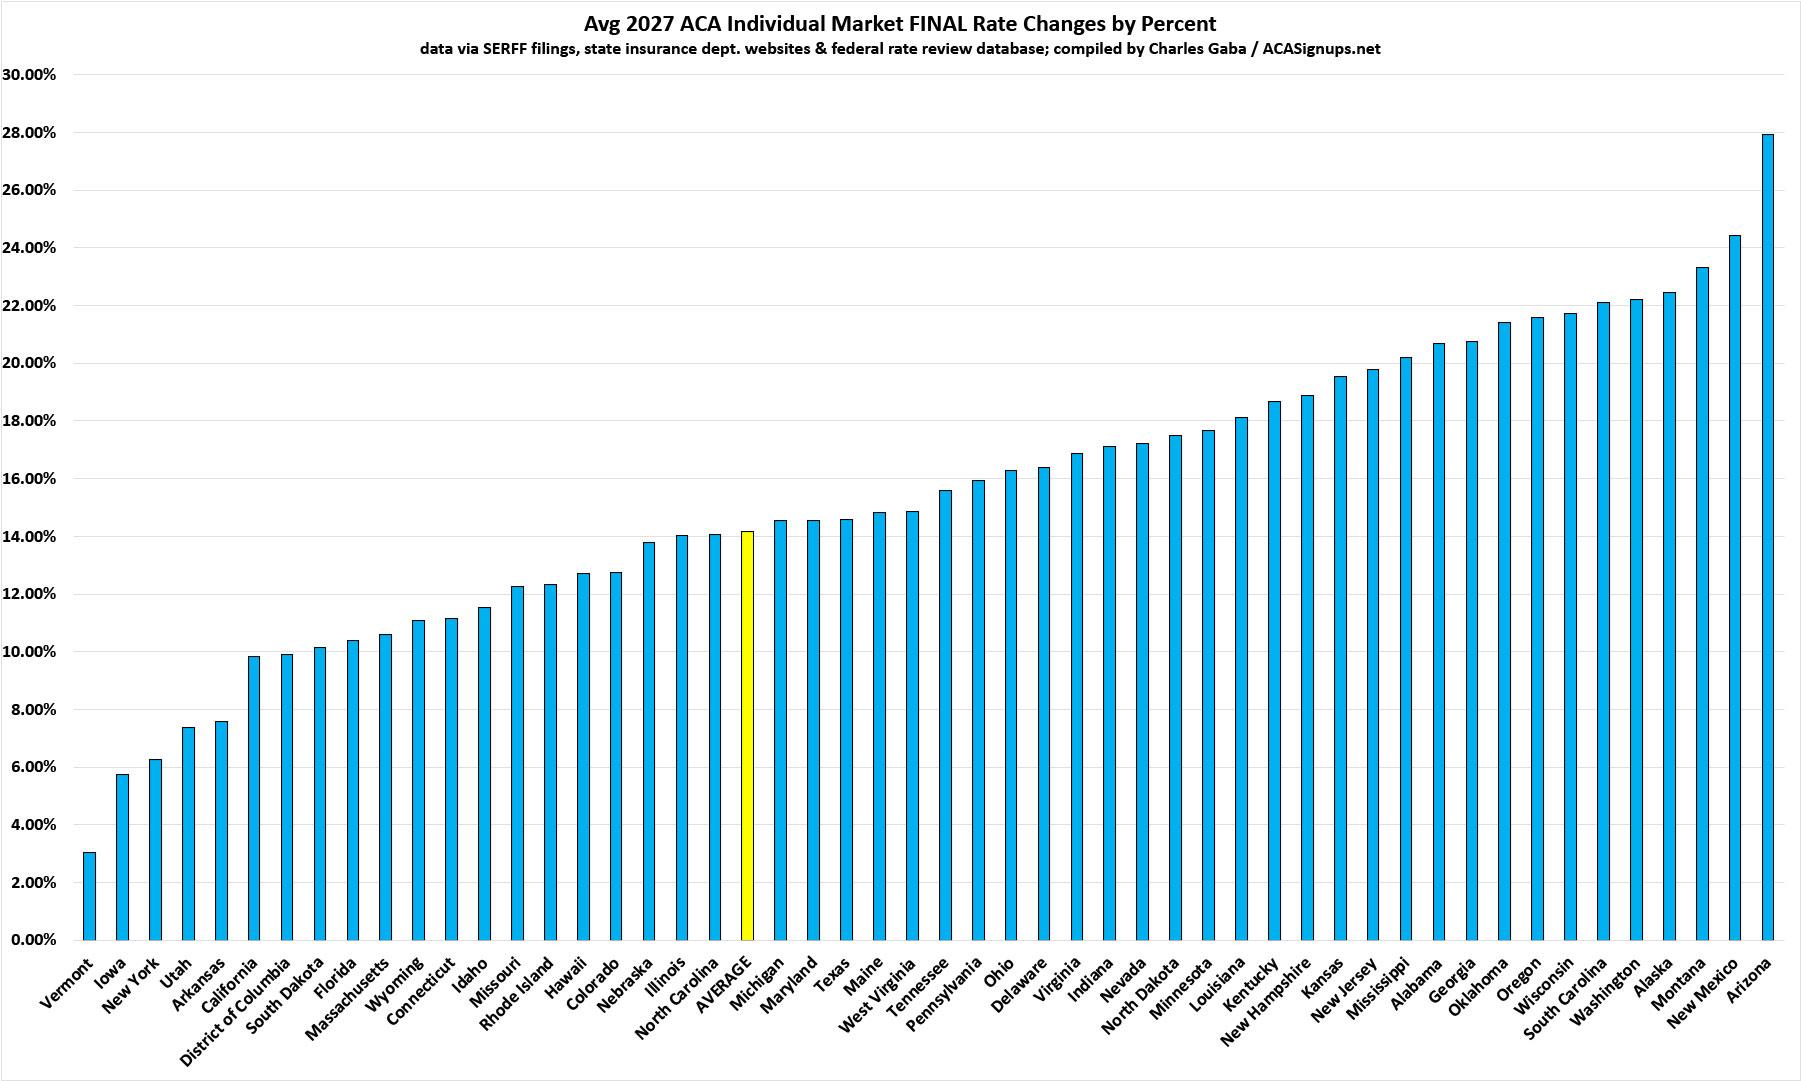
Final rates vary widely by state
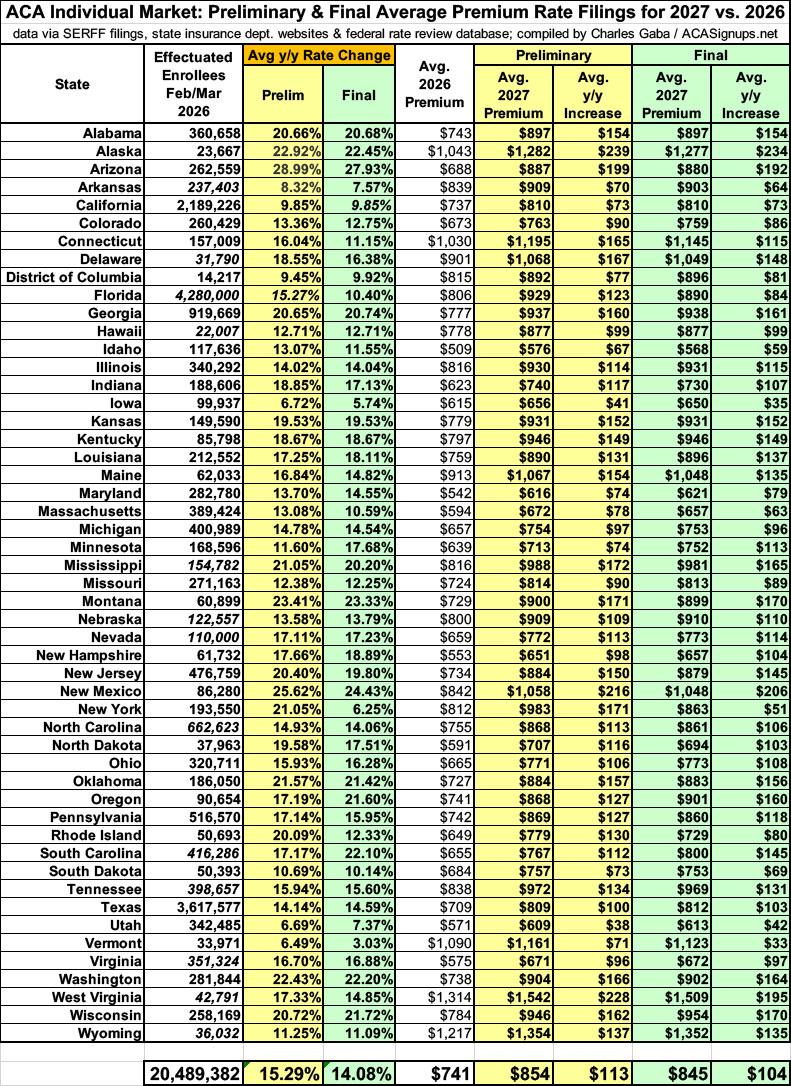
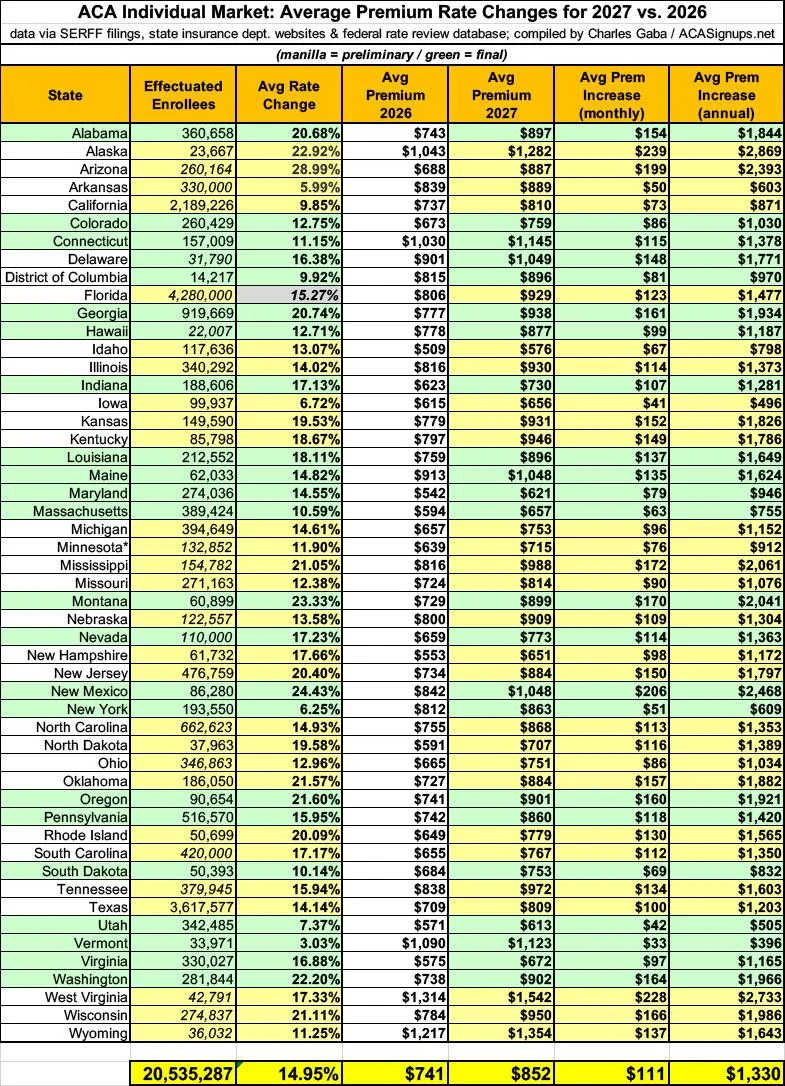
The final weighted average rate increases range from 3% in Vermont to 28% in Arizona. Average monthly premiums show a similarly broad spread: Idaho is lowest at $568, while West Virginia is highest at $1,509. The West Virginia average is nearly 2.7 times Idaho’s, illustrating why a national average may not describe what a particular household sees when comparing plans.
Seven other states join West Virginia with average unsubsidized monthly premiums above $1,000: Alaska, Connecticut, Delaware, Maine, New Mexico, Vermont and Wyoming. Those dollar averages describe premiums before financial assistance. They shouldn’t be read as the amount every enrollee will pay, since the figure varies with the plan selected and whether a person qualifies for assistance.
Why the national estimate shifted
The estimate began with preliminary rate requests, which showed an average increase of about 15.2%. At that point, approved figures were available for only a handful of states. By September 25, rates had been finalized in 23 states, and the national average had moved down by just a quarter of a percentage point, to around 15%.
The final update, dated November 4, includes all 50 states and Washington, D.C. The national weighted increase fell by about one percentage point from the preliminary estimate and settled slightly above 14%. Changes in individual states could be substantial, yet the overall figure moved less because it combines results across a much larger enrollment base.
There were limits to the early estimates. In some states, enrollment data for individual carriers was redacted, so the analysis used estimates for part of the weighting. Florida was a notable case: state rules kept all carrier enrollment figures out of view, making its initial 15.3% average unweighted. Florida also has the country’s largest ACA enrollment, and carriers’ initial requests there ranged from 3.9% to 39%. That made the state’s final weighted average a potential source of movement in the national figure.
The final nationwide calculation reflects completed rates and updated enrollment information, but the source describes enrollment totals as estimates. Small changes to state enrollment figures can alter how much each state contributes to the national result. Readers should treat the national average as a broad summary, while the state figures offer a more relevant starting point for comparing local premiums.
What the increase means in dollars
For an unsubsidized enrollee paying the estimated 2026 national average of $741 per month, a 14.1% increase translates to about $104 more each month in 2027, or roughly $1,248 over a year. The resulting average of about $845 per month is an estimate across the market; an individual’s bill may differ based on location and plan choice.
The final state averages also show why percentage increases and dollar costs tell different parts of the story. A state with a smaller percentage increase can still have a high monthly premium, while a larger percentage increase applied to a lower starting premium may produce a different dollar change. Both measures matter when considering what a rate update could mean for a household’s budget.
For people who buy their own coverage, the practical next step is to compare the available 2027 plans and their prices in their area. Those receiving assistance can review their estimated costs alongside the full premium, while people paying the full amount can use the state average as context rather than as a personal quote. The completed figures establish the broad direction for 2027: higher average costs nationally, with a wide range of local outcomes.
State-by-state analysis: individual and small group market rate changes. State pages include Vermont and Arizona.